Nonlinear Pushover Analysis: ETABS Setup, Plastic Hinges & Seismic Performance
Master pushover analysis in ETABS — plastic hinge modeling, ASCE 41 acceptance criteria, target displacement, and real retrofit case study with cost breakdown.
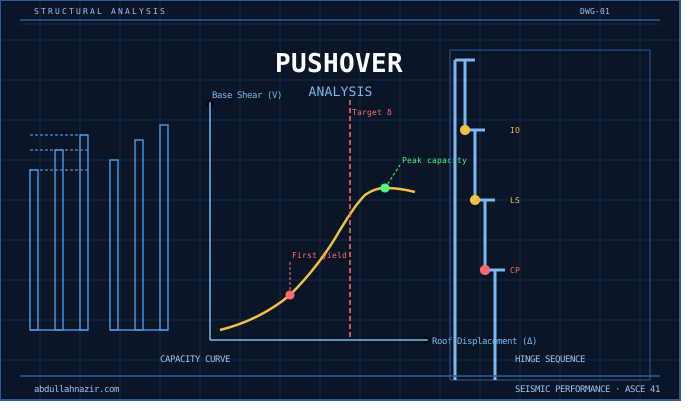
Performance-Based Seismic Design (PBSD) has fundamentally transformed how we evaluate existing structures and design new buildings in high-seismicity zones. Unlike traditional force-based design that checks member stresses, PBSD predicts actual structural behavior through nonlinear static pushover analysis—revealing the true collapse mechanism and deformation capacity.
This comprehensive guide takes you beyond basic analysis into the advanced techniques used by top seismic engineering firms for critical infrastructure and essential facilities.
The Fundamental Theory
Pushover analysis applies incrementally increasing lateral loads until the structure reaches a target displacement or collapses. The resulting capacity curve (base shear vs roof displacement) reveals:
- Elastic stiffness (initial slope)
- First significant yield (change in slope)
- Ultimate capacity (peak base shear)
- Ductility (displacement at collapse / yield displacement)
- Failure mechanism (beam vs column hinging)
Key Equation - Bilinear Idealization: Effective stiffness Keff = Vy / Δy and Ductility ratio μ = Δu / Δy, where Vy = Yield base shear, Δy = Yield displacement, and Δu = Ultimate displacement.
Plastic Hinge Modeling - The Critical Details
FEMA 356 and ASCE 41 provide moment-rotation relationships, but proper implementation requires engineering judgment:
For Reinforced Concrete Beams: Modeling parameters per ASCE 41-17 Table 10-7 include: a (Plastic rotation at IO - Immediate Occupancy) = 0.005 rad, b (Plastic rotation at LS - Life Safety) = 0.020 rad, and c (Plastic rotation at CP - Collapse Prevention) = 0.025 rad. The moment capacity is calculated as My = (As × fy × d) × (1 - 0.59 × ρ × fy/f'c), where As = Tension reinforcement area, fy = Yield strength of steel, d = Effective depth, ρ = Reinforcement ratio, and f'c = Concrete compressive strength.
Critical Considerations:
- Confinement effects: Spirally reinforced vs tied columns show 30-50% higher ductility
- Axial load ratio: P/(Ag × f'c) > 0.5 reduces rotational capacity by up to 60%
- Shear-flexure interaction: V/Vn > 0.75 requires reduced hinge acceptance criteria
- Lap splice locations: Old construction with splices at maximum moment zones = brittle failure
ETABS Implementation Workflow
Step 1: Define Nonlinear Material Properties
Concrete (Mander confined model): f'c = 30 MPa (unconfined), f'cc = 38 MPa (confined, with 15mm spiral @ 80mm pitch), εc = 0.002 (unconfined strain), εcc = 0.006 (confined ultimate strain). Steel (Bilinear with strain hardening): fy = 420 MPa, fu = 550 MPa, Strain hardening ratio = 0.02, Ultimate strain = 0.12.
Step 2: Assign Plastic Hinges
In ETABS: Beams get M3 hinges at both ends (0.05L and 0.95L), Columns get PMM hinges (axial-biaxial moment interaction), and Walls get Fiber hinges for distributed plasticity.
CRITICAL: Never use auto-hinges for critical structures. Always verify the moment capacity check by comparing ETABS calculated My with hand calculations. Typical variance should be less than 5%. If greater than 10% difference, investigate section properties.
Step 3: Define Load Pattern
Lateral load distribution options: (1) Uniform (equal force per floor) - conservative for regular structures, (2) SRSS (k × Φi × mi) - modal distribution per ASCE 41, (3) ELF (Fi = Cvx × V) - code-prescribed distribution.
For irregular buildings: Use SRSS with first 3 modes capturing greater than 90% mass participation. The force is calculated as Fi = Σ (Γn × Φni × mi × Sa(Tn)), where Γn = Modal participation factor, Φni = Mode shape amplitude at level i, and Sa(Tn) = Spectral acceleration at period Tn.
Step 4: Run Pushover Analysis
Monitor these parameters during analysis: Hinge formation sequence (should be beams first, then columns), Load step convergence (max iterations = 100, tolerance = 0.001), P-Delta effects (stability coefficient θ < 0.10), and Base shear vs roof drift ratio (target: 2-4% drift at CP level).
Red Flags: First hinge forms in a column indicates weak column/strong beam violation. Sudden drop in capacity curve indicates brittle failure mode. Soft story mechanism requires strengthening/stiffening.
Target Displacement Calculation
Coefficient Method (ASCE 41-17): The target displacement is calculated as δt = C0 × C1 × C2 × C3 × Sa × (Te²/4π²) × g, where C0 = Modal participation factor (typically 1.3-1.5), C1 = Inelastic drift amplification (1.0-1.5), C2 = Hysteretic behavior (1.0 for good, 1.2 for poor), C3 = P-Delta effects (1.0-1.3), Sa = Spectral acceleration at effective period Te, and Te = Effective period = Ti × √(Ki/Keff).
Capacity Spectrum Method (ATC-40): Convert capacity curve to Acceleration-Displacement Response Spectrum (ADRS) format using Sa = V / (α1 × W) and Sd = δroof / (PF1 × Φroof,1), where α1 = Modal mass coefficient (0.7-0.8 for regular frames), PF1 = Participation factor for first mode, and Φroof,1 = First mode roof amplitude. Plot on same graph with demand spectrum (reduced for damping) to find performance point.
Performance Acceptance Criteria
ASCE 41-17 Deformation Limits:
| Component | IO | LS | CP |
|---|---|---|---|
| RC Beams (controlled) | 1θ | 6θ | 8θ |
| RC Columns (P/Pn<0.4) | 1θ | 5θ | 7θ |
| RC Walls (ductile) | 0.4% | 1.0% | 2.0% |
| Steel Beams (compact) | 2θ | 7θ | 9θ |
Where θ is the plastic rotation capacity from Table 10-7.
Force-Controlled vs Deformation-Controlled: Shear in beams/columns is Force-controlled (DCR < 1.0 required). Flexure in beams is Deformation-controlled (m-factor applies). Flexure in columns (P/Pn>0.5) is Force-controlled if brittle details exist.
Case Study: 12-Story RC Moment Frame Retrofit
Building Details: 1975 construction (pre-seismic code), 12 stories at 42m height, Perimeter moment frame system, Seismic zone: SDC D (high seismicity).
Initial Pushover Results: First yield occurred at Column at 2nd floor @ 0.4% drift. Soft story formation at 1.2% drift. Capacity: 0.65 × DBE demand (inadequate).
Retrofit Strategy:
- Add RC shear walls at building ends (increased lateral stiffness by 180%)
- FRP wrapping of critical columns (increased confinement, ductility +40%)
- Steel jackets at 1st-2nd floor columns (prevented soft story)
Post-Retrofit Performance: First yield at Beam at 4th floor @ 0.8% drift ✓, Ultimate capacity: 1.25 × DBE demand ✓, Mechanism: Beam-siding (desirable) ✓, Target displacement at LS: 1.8% drift ✓.
Cost Analysis: Total retrofit cost: $2.8M, Cost per sq.ft: $42/sf, Alternative (demolish/rebuild): $18M, ROI on retrofit: 6.4× savings.
Advanced Techniques
Incremental Dynamic Analysis (IDA)
Run series of nonlinear time-history analyses with scaled ground motions where IM (Intensity Measure): Sa(T1) from 0.1g to 2.0g, DM (Damage Measure): Maximum interstory drift, and the Result produces IDA curves showing collapse capacity.
Fiber Section Analysis
For complex cross-sections (composite, irregular): Discretize section into 20×20 fiber grid, Assign material stress-strain to each fiber, Integrate strain over fibers to get moment-curvature. This approach is more accurate than tabulated hinge properties.
Soil-Structure Interaction
Foundation flexibility can increase period by 15-30% using the formula: Teff = Tfixed × √(1 + Kstructure/Kfoundation). Model using compression-only springs at base with stiffness from geotechnical report.
Software Comparison for Pushover Analysis
ETABS: Best for building structures ✓, Integrated with modal analysis ✓, Limited fiber hinge customization ✗.
SAP2000: More flexible element types ✓, Custom hinge programming ✓, Less streamlined workflow for buildings ✗.
Perform-3D: Purpose-built for nonlinear analysis ✓, Sophisticated component models ✓, Steeper learning curve ✗.
OpenSees: Unlimited customization ✓, Research-grade accuracy ✓, No GUI, scripting required ✗.
Practical Implementation Tips
- Always verify with hand calculations: Check first mode period, base shear, and at least 3 member capacities
- Start simple: Linear static → Modal → Pushover → Time-history
- Hinge sensitivity: Run with upper/lower bound material properties (±15%)
- Validate collapse mechanism: Physically visit similar buildings post-earthquake
- Document assumptions: Peer reviewers will scrutinize hinge models and acceptance criteria
Common Errors to Avoid
Using default hinge properties without verification - Instead, calculate hinge properties from actual reinforcement details.
Ignoring P-Delta in pushover analysis - Always enable geometric nonlinearity for buildings greater than 5 stories.
Single pushover direction only - Perform pushover in both ±X and ±Y directions.
Not checking force-controlled actions - Shear and axial forces must satisfy DCR < 1.0.
Assuming all buildings can be retrofitted to CP level - Some buildings are demolition candidates (be honest with clients).
Regulatory Context
International Codes: ASCE 41-17 (US standard for seismic evaluation), Eurocode 8 Part 3 (European approach with similar philosophy), NZS 1170.5 (New Zealand - most stringent), FEMA P-58 (Loss estimation methodology).
When Pushover is Required: Essential facilities (hospitals, fire stations), Existing buildings in high seismic zones, Structures with significant irregularities, Performance-based design approach.
Performance-based design through pushover analysis represents the state-of-practice for seismic engineering. It transforms structural analysis from a code-checking exercise into genuine performance prediction—revealing whether a building will sustain damage but remain standing, or collapse catastrophically.
The techniques covered here form the foundation for advanced seismic design practiced by top engineering firms worldwide. Mastery requires both theoretical understanding and extensive practical experience validating models against actual building performance.
.webp)
Abdullah Nazir
Structural Engineer & BIM Specialist — CEO of Defteng Pvt. Ltd.
Writes from real project work across Pakistan, the US, New Zealand, Australia and Belgium — structural design, BIM coordination, and the software that automates the repetitive parts of both.