Post-Tensioned Slab Design: Tendon Losses, Deflection & Punching Shear Explained
Full PT slab design walkthrough — equivalent load method, friction and long-term losses, deflection stages, punching shear at columns, and software comparison.
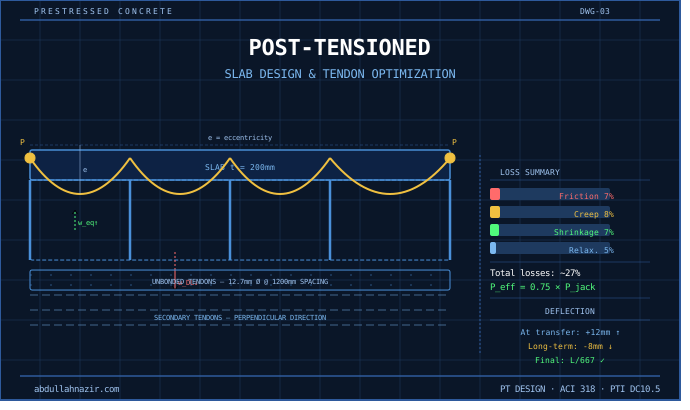
Post-Tensioned Slab Design and Analysis: Tendon Layout Optimization, Loss Calculations, and Long-Term Deflection Prediction
Post-tensioned (PT) concrete slabs enable column-free spans exceeding 12 meters, reduce slab thickness by 25-40%, and eliminate problematic crack patterns—but only when designed correctly. Improper tendon layouts cause excessive camber, cracking, and even edge lift-off failures.
This comprehensive guide covers the advanced analysis techniques required for reliable PT slab design, from first principles through software implementation and field verification.
Why Post-Tensioning?
Conventional RC Slab (8m span): Thickness: 250mm, Deflection: L/250 (borderline), Cracking: Moderate (>0.3mm width), Weight: 6.0 kN/m².
PT Slab (8m span): Thickness: 180mm (-28%), Deflection: L/500 (excellent), Cracking: None (precompression prevents), Weight: 4.3 kN/m² (-28%).
Economic Breakeven: Spans greater than 7.5m make PT cost-effective. Spans greater than 10m make PT significantly cheaper. Complex geometries often make PT the only viable solution.
Fundamental Theory - Equivalent Load Method
Post-tensioning creates internal forces that can be replaced by equivalent external loads for analysis.
Parabolic Tendon Profile: The upward equivalent load (kN/m) is calculated as weq = 8 × P × e / L², where P = Prestress force (kN), e = Eccentricity at midspan (mm), and L = Span length (mm).
Example Calculation: Given Span = 9000mm, Prestress = 1200 kN (4 × 12.7mm strands @ 300kN each), Eccentricity = 60mm (tendon at bottom, CGC near mid-depth). Therefore weq = 8 × 1200 × 60 / 9000² = 7.1 kN/m (upward). This upward load counteracts dead and live loads, resulting in minimal net deflection.
Tendon Layout Design
Primary Tendons (Spanning Direction): Continuous over multiple spans for efficiency. The optimal profile (moment-balanced) follows e(x) = emax × [4x(L-x)] / L², which results in parabolic drape matching moment diagram.
Secondary Tendons (Perpendicular): Typically unbonded, spaced 1200-1500mm. They prevent shrinkage cracking, distribute concentrated loads, and control edge lift-off.
Tendon Spacing Rules (PTI DC10.5):
- Maximum spacing in interior zones: 8 × slab thickness
- Maximum spacing at edge/column zones: 4 × slab thickness
- Absolute maximum: 1800mm
- Minimum spacing: 3 × duct diameter (typically 100mm min)
- Sufficient for concrete placement
Critical Zones:
- Column strips: High shear, need more tendons
- Middle strips: Flexure-controlled, standard spacing
- Cantilevers: Draped tendons in top, straight in bottom
- Edges: Additional tendons to prevent lift-off
Prestress Loss Calculations
Total long-term losses can reach 30-35% of jacking force. Accurate prediction is critical.
Immediate Losses (at stressing)
1. Friction Loss: The prestress at distance x from the jack is calculated as P(x) = Pjack × e(-μα - Kx), where μ = Wobble coefficient (0.0015-0.0020 per meter for plastic ducts), K = Curvature coefficient (0.15-0.25 per radian), α = Cumulative angular change (radians), and x = Distance from jack (meters).
Example: 30m long tendon, parabolic profile, 4° total angle change. α = 4° × π/180 = 0.070 radians, μ = 0.0020/m, K = 0.20/radian. Loss at far end: P(30) / Pjack = e(-(0.0020×30 + 0.20×0.070)) = e(-0.074) = 0.929. Therefore friction loss = 7.1% at far end.
2. Elastic Shortening (Bonded Tendons Only): For a single tendon in a slab, n = 1, so ΔPES = 0 (no interaction). For multiple tendons stressed sequentially, elastic shortening is typically 2-3% of Pjack. The formula is ΔPES = (n-1)/(2n) × (Es/Ec) × fcgp.
Long-Term Losses (over years)
3. Concrete Creep: ΔPCR = (Es/Ec) × φ × fcgp, where φ = Creep coefficient (1.5-2.5 for normal concrete) and fcgp = Stress at CGS due to prestress + permanent loads. Typical value: 6-8% of Pjack after 10 years.
4. Concrete Shrinkage: ΔPSH = Es × εsh, where εsh = Shrinkage strain (typically 500-800 microstrain) and Es = Steel modulus (195,000 MPa). Therefore ΔPSH = 195,000 × 0.0006 = 117 MPa, which is 6-7% of typical jacking stress (1400 MPa).
5. Steel Relaxation: For low-relaxation strand, ΔPRE = 0.05 × Pjack (at 1000 hours), which equals 3-5% total after 10 years.
Total Long-Term Losses (Typical unbonded PT slab):
- Friction: 5-8%
- Creep: 6-8%
- Shrinkage: 6-7%
- Relaxation: 3-5%
- Total: 20-28% at 10 years
- Effective prestress: Peff = 0.75 × Pjack
Deflection Analysis - Critical Procedure
Stage 1 - At Transfer (tendons stressed, no live load): Deflection components include Self-weight: ΔDL = 5wL⁴/(384EI) (downward) and PT equivalent load: ΔPT = 5weqL⁴/(384EI) (upward). Net: Δnet = ΔPT - ΔDL. Target: Small upward camber (L/1000 to L/2000).
Stage 2 - Long-Term (full prestress losses, sustained loads): Additional deflections include Prestress loss (reduces upward component), Creep (amplifies all deflections by factor (1 + φcreep)), and Shrinkage (additional camber reduction). The final deflection is predicted as Δfinal = (ΔDL + ΔSDL) × (1 + φ) - ΔPT × (1 - loss%) × (1 + 0.5φ).
Stage 3 - Under Live Load: Instantaneous live load deflection: ΔLL = 5 × wLL × L⁴ / (384 × Ec × Ieff), where Ieff = Igross for precompressed sections (accounts for cracking if any), or reduced I if tension exceeds modulus of rupture.
Case Study - 9m × 12m Flat Slab: Design parameters: Slab thickness = 200mm, Concrete = 35 MPa, Tendons = 12.7mm dia at 0.6 ultimate load, Average prestress = 2.5 MPa. Calculated deflections: At transfer: +12mm (upward camber), Long-term DL+SDL: -8mm (slight sag), DL+SDL+LL: -18mm (L/667 - acceptable).
Punching Shear at Columns - PT-Specific Considerations
Post-tensioning significantly improves punching capacity.
ACI 318-19 Approach: Vc for PT slabs = min of: (1) (2 + 4/β) × √f'c × b0 × d × (1 + Vp/Vu), (2) (αsd/b0 + 2) × √f'c × b0 × d × (1 + Vp/Vu), and (3) 4 × √f'c × b0 × d × (1 + Vp/Vu), where Vp = Vertical component of tendons crossing critical section and Vu = Factored shear from gravity loads.
Tendon Contribution: Vp = Σ (Pi × sin θi). For parabolic profile through column: θ ≈ 8e/(L × 1000) radians (small angle), therefore Vp = P × 8e/L.
Example: Interior column 400×400mm, Critical section d/2 away gives b0 = 4(400+200) = 2400mm, d = 160mm (effective depth). Tendons crossing section: 8 tendons @ 1200kN each, Drape: 60mm over 9000mm span. sin θ = 8×60/9000 = 0.053, Vp = 8 × 1200 × 0.053 = 510 kN. Enhancement factor: (1 + 510/800) = 1.64. Therefore punching capacity increases 64% over non-PT slab.
When PT Alone Is Not Enough:
- Very high live loads (>7.5 kPa)
- Slab thickness < 200mm
- Large column spacing (>9m)
Solutions:
- Column capitals (drop panels)
- Shear reinforcement (studs, stirrups)
- Increase slab thickness locally
- Add additional tendons in column strips
Design Workflow - Step by Step
Step 1 - Preliminary Sizing: Span-to-depth ratios: Flat plates = L/45 to L/50, Flat slabs (drop panels) = L/40 to L/45, Beams = L/20 to L/25. Example: 10m span gives 200-225mm slab thickness.
Step 2 - Load Analysis: Dead load = Self-weight + SDL (flooring, partitions, MEP). Live load per code (offices: 2.5-4.0 kPa). Load factors: 1.2D + 1.6L (ACI 318).
Step 3 - Tendon Layout: Primary direction (long span): Spacing = 1200-1500mm, Force per tendon calculated from load balancing as P = wbal × L² / (8e). Secondary direction: Minimum reinforcement to control shrinkage, typically 0.5-0.7 kg/m² (vs 1.5-2.0 kg/m² primary).
Step 4 - Loss Calculations: Use refined estimates: Friction from actual tendon path geometry, Time-dependent from age at stressing, humidity, concrete mix. Software options: RAM Concept, ADAPT-PT, or manual spreadsheet.
Step 5 - Stress Checks: At transfer (Pjack - immediate losses): Compression fc < 0.6 f'ci (initial strength), Tension ft < 0.25 √f'ci (generally no tension). At service (Peff after all losses + service loads): Compression fc < 0.45 f'c, Tension ft < 0.5 √f'c (Class U, uncracked).
Step 6 - Ultimate Strength: Moment capacity (unbonded PT): Mn = Aps × fps × (d - a/2) + As × fy × (d - a/2). For unbonded tendons per ACI 318-19: fps = fse + 70 + (f'c/100 × ρp) ≤ fpy. Typical: fps = 1600-1750 MPa (vs 1860 MPa bonded).
Step 7 - Serviceability: Deflections checked at transfer, long-term, and under live load. Cracking generally none if properly designed. Vibration: Natural frequency > 4 Hz for residential/offices.
Software Comparison
RAM Concept (Bentley): Integrated analysis and design ✓, Sophisticated loss calculations ✓, Automated tendon layout optimization ✓, Expensive ($8K+ per license) ✗.
ADAPT-PT: Specialized for PT design ✓, Excellent tendon balancing algorithms ✓, Separate analysis required for complex geometries ✗.
SAFE (CSI): Integrates with ETABS ✓, Reasonable cost (~$3K) ✓, Less sophisticated tendon optimization ✗.
Midas Civil: Handles complex bridge decks ✓, Time-dependent analysis ✓, Steep learning curve ✗.
Common Design Errors
Insufficient anchorage zone reinforcement - Bursting forces can crack slab at anchorages. Use spiral reinforcement.
Ignoring tendon eccentricity variation - Tendons must have physical space for drape. Check against duct clash.
Underestimating long-term losses - Conservative loss estimates prevent cracking from loss of precompression.
Poor tendon detailing at openings - Deflect tendons around openings with adequate radius (greater than 6m typically).
Neglecting construction sequence - Stressing sequence affects redistribution. Coordinate with contractor.
Field Verification
During Stressing: Monitor jack pressure and elongation. Elongation should match calculated value ±7%. Record actual losses for comparison with design.
After Construction: Survey slab elevations at transfer and 28 days. Compare actual camber vs predicted. Significant deviation (>25%) indicates design/construction issue.
Long-Term Monitoring: Re-survey at 6 months and 1 year. Check for excessive deflection or cracking. Document for future projects (refine loss models).
Performance Comparison Table
| Parameter | RC Flat Slab | PT Flat Slab | Improvement |
|---|---|---|---|
| Span (m) | 6-8 | 8-14 | +75% |
| Thickness (mm) | 250 | 180 | -28% |
| Deflection | L/250 | L/500 | 2× better |
| Cracking | Moderate | None | Eliminated |
| Self Weight (kN/m²) | 6.0 | 4.3 | -28% |
| Story Height Saving | — | 70mm/floor | Significant |
Regulatory and Code References
Design Codes: ACI 318-19 (Chapter 22 - PT slabs), PTI DC10.5-12 (Unbonded single strand tendons), AS 3600-2018 (Australian standard), Eurocode 2 EN 1992-1-1 (European approach).
Inspection Standards: PTI DC80.3 (Specification for unbonded tendons), ASME B31.3 (Pressure systems for grouted PT), ACI 423.7 (Specification for bonded tendons).
Post-tensioned slab design requires mastery of prestress mechanics, material behavior, and long-term performance prediction. The techniques in this guide—from tendon optimization through loss calculations and deflection control—represent best practices developed over decades of PT construction worldwide.
The difference between a good PT design and a problematic one often comes down to accurate loss prediction and rigorous serviceability checks. Master these fundamentals and you master PT design.
.webp)
Abdullah Nazir
Structural Engineer & BIM Specialist — CEO of Defteng Pvt. Ltd.
Writes from real project work across Pakistan, the US, New Zealand, Australia and Belgium — structural design, BIM coordination, and the software that automates the repetitive parts of both.